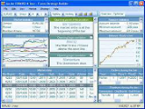
Multiple time frame Bollinger Bands
Using longer timeframe chart to find the direction of a trend and using shorter time frame chart to determine the entry point.
If we use daily chart as longer time frame chart, with a Bollinger Band with default setting, the middle line is the 20 SMA. If a pair is traded above the 20 SMA, it is in an up trend. If a pair is traded below the 20 SMA, it is in a down trend.
Then we can move to the shorter time (e.g. 4 hour or 1 hour). Here we are looking for the weakness or strength of the trend that we identified on daily chart. For an uptrend, we are looking for the price touching the lower bands (weakness). For a down trend, we are looking for the price touching the upper bands (strength). These weakness/strength points become our entry points.
The below charts show an up trend starting from May 20 on daily chart. On 4 hour chart, a weakness point was found on May 25. That could be a good time to enter in a long position.


Forex Strategy Articles & News

There are many factors that affect exchange rates of currencies. However some are more important in currency trading than others. These are; Interest and Inflation rates, Trade balance, Currency market speculation, Foreign investment and Central bank market intervention. Learn how to use these factors in your forex tra ...