Technical analysis
The main rationale behind technical analysis is the assumption that all current market information is reflected in price already. If this is true, why do you need information other than price to make a trade when price reflects all available information?
Technical indicator
A technical indicator is a series of data points derived by a formula applied to statistics associated with a currency. Some indicators may use only the prices, while others also take volume and open interest into their formulas. The price data here can be any combination of the open, close, high, or low for an extended period of time. For example, the average of 5 consecutive day closing prices of EUR/USD is one data point ((1.3345+1.3389+1.3456+1.3272+1.3117)/5=1.3316).
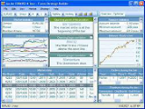
However, one data point does not offer much information for analysis. A time series of data points over a period of time constitutes valid points of reference to compare between present and past levels. Technical indictors oftentimes are plotted above, below or on top of a currency's price chart for analysis. In this sample EUR/USD daily chart, 20 days, 50 days and 100 days moving averages are plotted on top of price candlestick chart, while a momentum indicator Relative Strength Index (RSI) is plotted below the price chart.

Technical indicators have two main groups, trend following (lagging) indicator and trend predicting (leading) indicator. Traders who employ a trend predicting strategy profit by forecasting or predicting specific price levels, while trend following indicator users simply jump on the trend and ride it.


- Technical analysis
- Fundamental analysis
- Sentimental analysis
- Money management

1. Introduction to forex
- What is forex?
- Forex Vs. Stocks: Answer to why forex?
- Millionaires in forex
- Currencies are traded in pairs
- Key forex players
- Forex market hours
- What affects value of currency?
2. How it works?
3. How to do forex analysis?
Forex Educational Articles & News

There are many factors that affect exchange rates of currencies. However some are more important in currency trading than others. These are; Interest and Inflation rates, Trade balance, Currency market speculation, Foreign investment and Central bank market intervention. Learn how to use these factors in your forex tra ...